COURTESY : www.carbonbrief.org
Eradicating poverty
The study, published in Nature Sustainability, highlights the global inequality in emissions between people in rich and poor countries. For example, it finds that the average carbon footprint of a person living in sub-Saharan Africa is 0.6 tonnes of carbon dioxide (tCO2). Meanwhile, the average US citizen produces 14.5tCO2 per year.
The authors find that the average carbon footprint in the top 1% of emitters was more than 75-times higher than in the bottom 50%.
“The inequality is just insane,” the lead author of the study tells Carbon Brief. “If we want to reduce our carbon emissions, we really need to do something about the consumption patterns of the super-rich.”
A scientist not involved in the research says that “we often hear that actions taken in Europe or the US are meaningless when compared to the industrial emissions of China, or the effects of rapid population growth in Africa. This paper exposes these claims as wilfully ignorant, at best”.
Emissions inequality
Humans release tens of billions of tonnes of CO2 into the atmosphere every year. However, the distribution of these emissions is unequal – as they are disproportionately produced by people in wealthier countries who typically live more carbon-intensive lifestyles.
The new study uses what it calls “outstandingly detailed” global expenditure data from the World Bank Consumption Dataset from 2014 to assess the carbon footprints of people in different countries, and with different consumption levels.
Dr Klaus Hubacek is a professor of science, technology and society at the University of Groningen and an author on the study. He tells Carbon Brief what is included in consumption figures:
“Driving the model with the consumption patterns calculates the carbon emissions not only directly through expenditure for heating and cooling, but the embodied carbon emissions in the products they buy. So it’s taking account of the entire global supply chains to calculate those carbon emissions.”
Dr Yuli Shan – a faculty research fellow in climate change economics at the University of Groningen – is also an author on the study. He explains that using consumption data ensures that carbon emissions are linked to the countries that use goods and services, rather than the countries that produce them. This is important, because “poor countries emit large quantities of CO2 due to the behaviour of people in developed countries”, he adds.
The map below shows the average carbon footprints of residents of the 116 countries included in the study. The shading indicates the size of the carbon footprint, for low (blue) to high (red). Note the exponential scale on the colour bar.
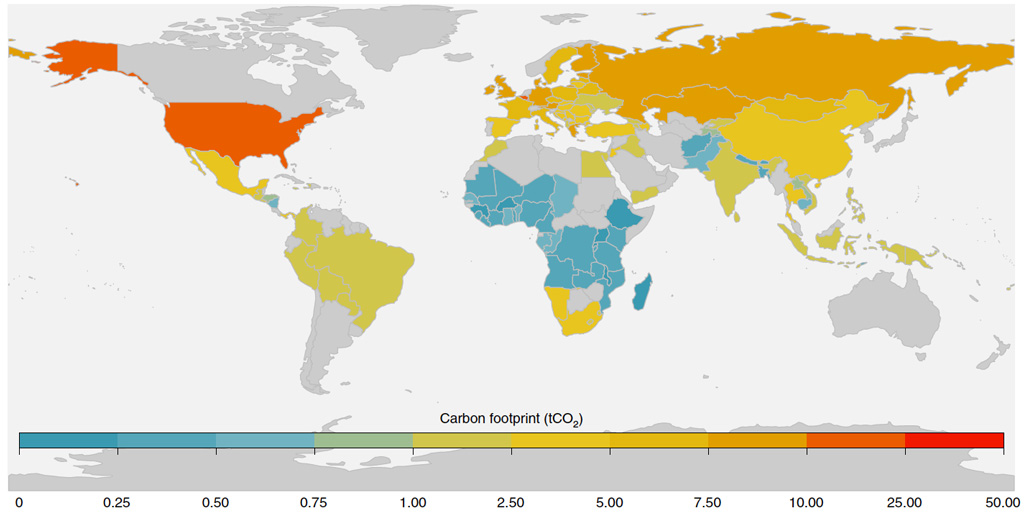
The authors find that Luxembourg has the highest average national per capita carbon footprint in the study, at 30tCO2 per person, followed by the US with 14.5tCO2. It is worth noting that a number of countries with high per-capita emissions are not included in the study, such as Australia, Canada, Japan, Saudi Arabia and Iran, as these are not included in the dataset.
In contrast, Madagascar, Malawi, Burkina Faso, Uganda, Ethiopia and Rwanda all have average carbon footprints of less than 0.2tCO2.
Dr Shoibal Chakravarty is a visiting professor at the Divecha Centre for Climate Change and was also not involved in the research. He tells Carbon Brief that the study “significantly improves on previous attempts” to measure per-capita emissions, and is “more rigorous that past efforts”.
The rich and the ‘super-rich’
Within each country, the authors also split the population into groups based on how much they spend, on average. Benedikt Bruckner – the lead author on the study, also from the University of Groningen – tells Carbon Brief that while previous studies typically used four or five groups, this study uses more than 200.
The high number of “expenditure bins” allows for “more precise, more detailed [and] more accurate” analysis, Hubacek says.
When including bins, the spread of carbon footprints ranges from less than 0.01 tCO2 for more than a million people in sub-Saharan countries to hundreds of tonnes of CO2 for about 500,000 individuals at the top of the “global expenditure spectrum”, the authors find.
The authors then split the global population into the top 1%, next 9%, next 40% and bottom 50% of emitters. Their share of global emissions (left) and average carbon footprint (right) are shown in red, yellow, light blue and dark blue below, respectively.
The global share of carbon emissions (left) and average carbon footprints (right) of the top 1%, next 9%, next 40% and bottom 50% of emitters. Chart by Carbon Brief, using Highcharts. Credit: Bruckner et al (2022).
The study finds that the average carbon footprint in the top 1% of emitters is more than 75-times higher than that in the bottom 50%.
This gap is “astonishing”, Dr Wiliam Lamb – a researcher at the Mercator Research Institute who was not involved in the study – tells Carbon Brief. He adds that responsibility for global emissions lies with the “super-rich”:
