Courtesy : www.mdpi.com
Energy management design
In the mining industry, technological advancements are being successfully applied to enhance the productivity and the performance using the industry 4.0 concept . However, energy management and efficiency have not kept pace with these changes, which is a key element to directly optimize the energy consumption and increase profitability. The objective of this work is to design a new architecture for a smart energy management system according to ISO 50001 standard for mining industry . The application was oriented to an experimental open-pit mine respecting all requirements and needs. After studying these requirements, we proposed a prototype which simulates the control and data acquisition system of the open-pit architecture. The use of the plan-do-check-act methodology proposed by the ISO 50001 standard shows the integrity of the applied architecture with the requirements .
In the design phase of this application and before implementation, a full study on the control system was done, showing lack of infrastructure. The open-pit mine was designed in the first place for production regardless of energy consumption or grid quality predictive maintenance. So, to overcome this challenge, new hardware was installed in parallel with the existent infrastructure, including smart meters, programmable logic controllers and servers . The developed communication and data recording program was tested and validated through the prototype before implementing it in the open-pit mine. After acquiring data, a predictive model was proposed using the fast forest quantile regression to forecast the energy consumption. The visualization of real time and predicted values was developed in the same SCADA system using the Citect Scada software and for web access using things board solution which still under design for security reasons
One of the biggest challenges in applying the energy 4.0 transition in the open-pit mine was infrastructure. A large investment in hardware was required to monitor all types of loads in the three stations. Another issue was cybersecurity because the recorded data in the server must have access to production KPIs linked to the intranet, which has strict security standards.
The study presents a full design and architecture for applying a smart energy management system in mining industry regardless the situation and the technology of the control system adapted because the use of OPC data transmission this system can be implemented in different types of open pit mines .
The goal behind this work is offering a novel energy management system infrastructure for a typical open-pit mine, where the system can record, monitor different energy and electrical grid quality data, and give insights on the grid’s real-time state of health. The system proposes a load forecasting algorithm to predict the energy demand response in the open-pit mine. This proposed and tested architecture will enable the different smart microgrid features such as optimization and load scheduling techniques, power shedding, decentralized energy production through renewable sources and energy storage systems, and making the energy audit procedures easy using report generation function.
2. The Challenges of the Implementing the Smart Energy Management System in the Open-Pit Mine
2.1. Introduction
The experimental open-pit mine was initially designed for a required function: to extract mining products and maximize the production, regardless of energy consumption and grid quality monitoring. The maintenance technicians use a curative and preventive maintenance system. The supervisory control and data acquisition (SCADA) was completely oriented to process machining supervision and production key performance indicators . The goal of this study is to redesign the control system and integrate the energy and electrical grid data by giving insights and predictions.
2.2. Monitoring All Different Loads and Supplies
In the open-pit mine, the main components of the mining machines, such as bucket wheel reclaimers, stackers, draglines, jaw crushers, conveyors, screening and loading stations, are squirrel cage induction motors (SCIM) and direct current (DC) motors. The number of machines per stage is very big, the goal is to instrument all these loads by energy sensors, so the amount of data will be very huge to store, to visualize and to process . The monitoring techniques used in this work are global to specific, supervising different process stages, destoning, screening and train loading. The goal is to prepare a first proof of concept (POC) that validates the idea then to go to specific load consumption monitoring.
2.3. Feeding the Supervisors by Real Time Energy Data on the Same Process SCADA View
After studying the requirements of the supervisory control and data acquisition (SCADA) system, to implement such a solution, all hardware, recorded data, processed data and views must be embedded in the same process SCADA system, in order to facilitate monitoring by the supervisors so they can have insights on process, maintenance, energy consumption and forecasted data.
2.4. Parallel Integrating Hardware Solutions to the Same Process Control System
The biggest challenge that we faced during while implementing the POC was not to impact the process control system or the database server. The solution was to integrate parallel sensors to acquire energy data using the same programmable logic controller (PLC) so the data acquisition system was very limited because the PLC is used for controlling the process. The data collection must be stored in the same database of the production to find correlations, but it was forbidden to change the architecture, so we added a parallel database and fed it from the first one.
2.5. Predict the Energy Demand Response Based on the State of Different Historical Scenarios
One of the needs is to understand the behavior of some machines and to calculate the energy efficiency of each component, such as conveyors which transport the same amount of mined material, by storing the demand response of each machine, in order to take maintenance decisions and optimize the production strategy and the stage-scheduling program .
2.6. Finding Correlations between the KPIs of Energy Consumption and Mine Production Process
The goal after acquiring data from different system components was to look for correlations between different KPIs, so the open-pit site managers could have insights about the causes of problems and act as rapidly as possible. In this study we used the fast forest quantile regression to make a data-driven model on the impact of different stages on the specific and the general open-pit energy consumption .
2.7. Giving Insights on the Electrical Grid Quality
By introducing such a system, the installed smart energy sensors gave power grid quality basic readings: voltage, current, frequency and energy in real time . So, the calculation of other variables such harmonics, voltage sags, voltage swell, RMS, and others, can help to give general insights about power grid quality and can also detect abnormal behavior in different components .
2.8. Real-Time Energy Consumption Feedback Tarrif
The goal was to help the energy manager in taking decisions and preparing reports. The real time energy consumption views must integrate the price value and compare it to the profit . Those reports can be used to anticipate and predict the specific annual energy consumption and make negotiations and agreements with energy supplier companies easy to manage .
2.9. Cybersecurity and Data Sharing
As mentioned, the first server that collects production data is mandatory and is connected to different sites. The new designed system must have a parallel data base, so feeding the second database from the first one makes the solution very challenging because the results of the acquired data processing must be shared through the same SCADA views. That is why the PLC were directly connected to the sensors, so the system would be secured and integrated in the same intranet. However, a parallel cloud database was set as a backup of the second database, respecting the network security requirements .
3. Methodology of the Integrated Smart Energy Management System
The smart energy management system (SEMS), as shown in Figure 1, is a dataflow of energy consumption, generation data, between SCADA, SCADA back up for redundancy, the database, and the supervision dashboard, which shows the forecasted and predicted energy profile and demand response of the different components of the open-pit mine electrical grid. It detects all anomalous equipment and its placement using a geographical information system for easy and direct maintenance .
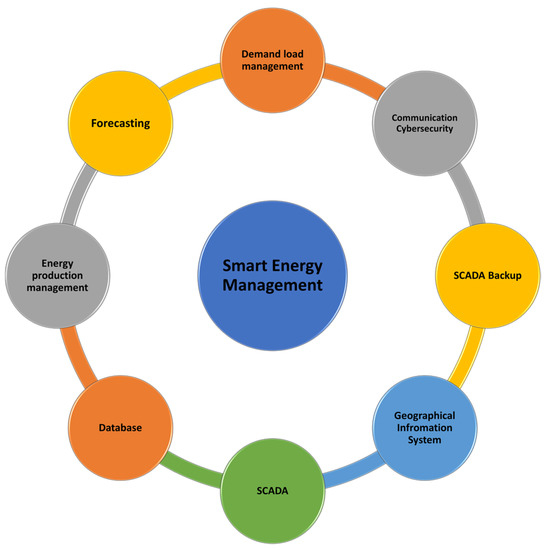
Figure 1. A smart energy management system general schematic.
In such a system, cybersecurity management ranks highly and has a critical priority because of the flow of energy. A cyberattack can generate false data and falsify the algorithm to give wrong decisions that can risk insufficient energy management, low indicators, false anomalies alarms, and even blackout, so to maintain an online SEMS, a cybersecurity strategy must be implemented and always maintained .
Figure 1 represents a general schematic of different components of the SMES on which we based the design of the open-pit mine system solution. The next step was to choose the methodology.
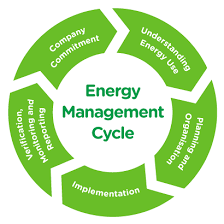
According to ISO 50001 standard , which is the guide to design energy management systems respecting specific requirements, the use of the methodology, plan-do-check-act (PDCA) has shown satisfying results to achieve continuous improvement. Figure 2 shows the general PDCA cycle of different SEMS goals .
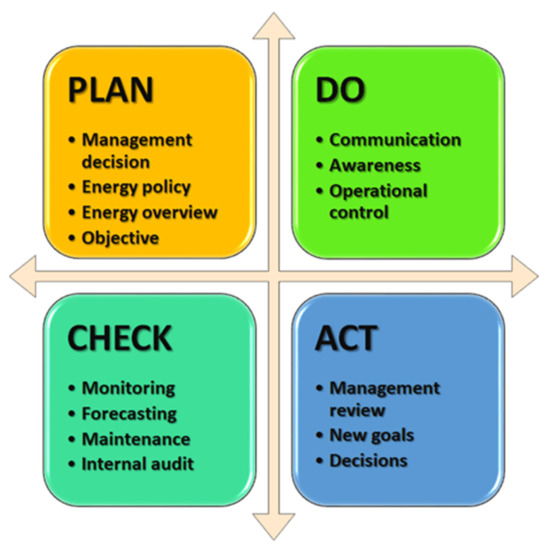
Figure 2. A general PDCA schematic of the smart energy management system approach.
In the plan phase, the SEMS will be designed to achieve the main objective which is minimizing the energy consumption and sending alarms whenever an abnormal consumption is detected. It must share in real time the energy data of different stages of the open-pit mine. It gives insights on the energy policy and help energy managers to have better decisions. In the do phase, the system must have interactive views that communicate with different open-pit components and stakeholders, by sharing data, alarms, insights and reports and aware them, those alarms can operate and control directly the system if there is a critical anomaly detection . In the act phase, the stakeholders can review the SEMS and decide new energy efficiency goals to improve the system. In the check phase, the stakeholders, and principally the energy managers, can check and analyze the SEMS, monitoring system, predictions and generated reports. They must use those reports as an input for maintenance planning and preparing internal energy audits.
After having a general view of the PDCA methodology, we must define how can this approach increases the profitability. Figure 3 describes the steps required to apply the methodology, by raising the energy consumption awareness of the open-pit stakeholders, then starts a full internal audit on the different equipment and classifies them into the plant benchmarks. After completing the planning phase, we must identify the top opportunities and risks using of the existent state, to make the project implementation more reliable and complete the do phase. All generated reports and feedbacks based on acquired and processed data are used to check the performance of the system. After revising and analyzing reports, the energy manager prepares the budget of the energy consumption and adds more ISO tasks answering the feedbacks of all SEMS stakeholders, to improve continuously the system and recreate the awareness strategy .
Figure 3. A scheme describing the result increasing profitability using the plan-do-check-act approach of ISO 50001. Reprinted with permission from Ref.. Copyright 2022 IEEE.
4. State of Art of the Smart Energy Management Systems
4.1. Introduction
Energy management is becoming a more important component of industrial energy efficiency strategies. Recent work indicates that the mining industry is still in the early phase of energy 4.0, digital twins application and the transition . Knowing that industrial businesses are scrutinizing their energy profiles more thoroughly for cost-cutting, decarbonization, and resilience purposes. They are progressively using energy management systems and thinking about onsite resources such as renewable energy and energy storage. Many people are taking part in current utility programs to meet their energy management objectives, and some see further potential in the more participatory electric utility and market programs .
Many researchers are trying to digitize energy management systems and machine learning so it can help forecast, analyze, and diagnose anomalous and abnormal energy consumption behavior, by proposing models and ensuring proper supervised learning capabilities in a microgrids cluster environment . The use of sophisticated machine learning, for an effective energy management strategy for microgrid, such as forecasting, and scheduling has shown very satisfactory results in power plants . The same goes for hybrid energy systems, using the machine learning in order to choose the optimal combination from the available energy sources based on different criteria . The goal is to apply the same approaches in the mining industry and combine solutions, by testing different algorithms then comparing the outcomes to select the algorithm with the best performance and to rank them in terms of both performance and accuracy .
4.2. Peak Load Forecasting Models
The energy consumption prediction and peak load forecasting is an important feature in the proposed design. After collecting the data and completing the integration of hardware with the SCADA system is the phase to choose the best peak load forecasting model to validate the POC.
Based on a comparative study proposed in recent work , we can see that the quantile regression model has very satisfying results. Table 1 shows the different applications of quantile regression, neural networks, and support vector machines to predict the energy consumption and the peak load. So, we chose to apply fast forest quantile regression (FFQR) to complete the proposed design as a first version of algorithm. In future work we will test more algorithms to enhance the models and improve the prediction while the data are being recorded and first results are analyzed.
Table 1. Comparative study of peak load forecasting models.
In recent work, a training and testing model was used to predict abnormal energy consumption for residential building . The goals, as shown in Figure 4, were collecting time series data from smart meters, processing the data and extracting the principal features, training the model using support vector machine, and then predicting the abnormal energy consumption behavior of each open-pit equipment . This feature can be proposed after validating the proof of concept of this designed infrastructure.
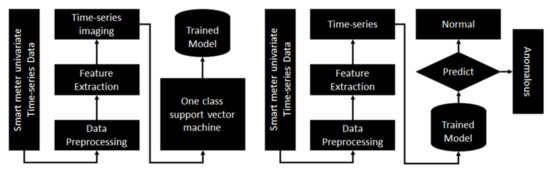
Figure 4. Training and testing model to predict the normal and abnormal energy consumption for a residential smart building. Reprinted with permission from Ref.. Copyright 2022 IEEE.
4.3. Smart Energy Meter
The key component in the proposed SEMS architecture in the open-pit mine application is the energy meter. In this section, we select the best energy meter that can fit perfectly with the existing SCADA architecture. We used PM8000 Schneider energy meters, which can communicate easily with the PLCs through the Modbus protocol. The power meter measures all the basic readings .
The PLC transfers all the acquired data to the energy database, as shown in Figure 5. Then the predictive model calculates the forecasted data, after the preparation, modelling and evaluating processes. The SCADA system shows both real time data and forecasts energy consumption [25]. It also shows alerts and the abnormal consumption , so the technician could take decisions.
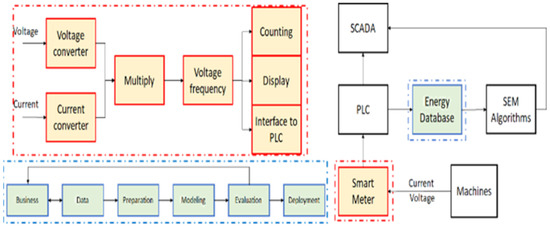
Figure 5. A scheme of energy metering, storing, predicting and real-time monitoring for industry. Reprinted with permission from Ref. . Copyright 2022 IEEE.
4.4. Smart Energy Management System Architecture
In this section, we have based our design on an architecture proposed in recent work , where the SEMS is presented in Figure 6 as a data flow from different open-pit sections. In the field, all monitored machines and equipment, such as draglines, bucket wheel reclaimers and conveyors, are instrumented by current and voltage sensors, depending on the values of the equipment, regarding the accuracy, drift, linearity, phase shift, integration, and price, of course. The sensors installed are interfaced with power meters, which communicate directly with PLC in the control layer, the PLC interface with the SCADA system to collect, store and visualize the data. In the artificial intelligence layer of the SEMS, the database feeds the defects diagnosis and the load forecasting algorithms, which report the current and the predicted state of the demand response .
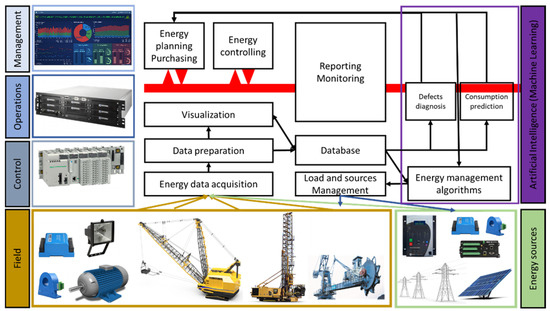
Figure 6. Physical, software and artificial intelligence layers implementation scheme in a mining industry. Adapted with permission from Ref. . Copyright 2022 IEEE.
In the operational layer, the SEMS manages the load and sources in order to optimize the energy efficiency and improve the system as well, these operations reports to management layer where the energy manager can oversee all changes and can take real time decisions .
Figure 7 shows the general subsystems of a SEMS that can be implemented in industries, typically chemical processing and the mining industry. The data management subsystem collects energy consumption and generation data and runs the regressors to forecast the energy profile and demand then uses the classification algorithms to diagnose the system, detect abnormal consumption and anomalies and predict critical grid failures .
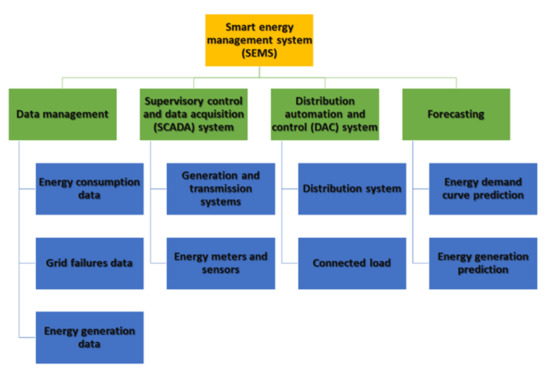
Figure 7. Smart energy management system general subsystems.
The supervisory control and data acquisition system is implemented and connected to energy meters and the process system which allows an efficient and fast data acquisition and processing.