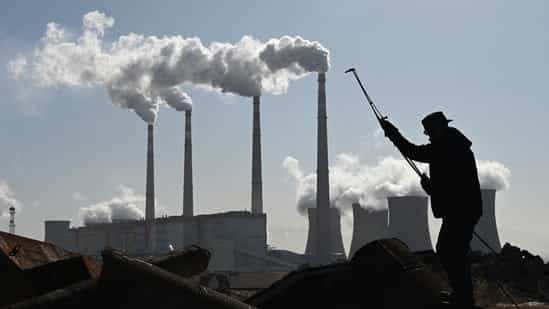
Courtesy :energyandcleanair.org
Coal emission
Coal-fired power plants are one of the largest sources of health-harming air pollutants being emitted into the atmosphere. This includes the three “major” air pollutants — sulfur dioxide (SO2), nitrogen oxide (NOx) and particulate matter (PM) — as well as mercury and other toxic heavy metals. As large, stationary point sources, they represent a low-hanging fruit in efforts to protect public health and citizens from air pollution. Because emissions originate from only a few thousand sites worldwide with one large emission point or stacks, the sector is relatively easy to monitor and regulate.
One of the ways in which pollution is controlled is by capping the concentration of pollutants that a coal plant is allowed to emit using emission standards. However, emissions standards and the degree to which they are enforced varies widely among both high- and low-to-medium income countries. As a part of our research efforts, CREA maintains an up-to-date database of emissions standards that aims to cover most of the world’s largest coal users.
The tables below simplify the complexity of regulation by only showing the emission limits applying to large (varyingly, >50MW to >500MW) plants. They also do not cover all exemptions either to individual plants or specific categories of plants which exist in many countries. The values are converted to 6% reference oxygen content, the most common basis used e.g. in the EU and China.
Emission limits for existing coal-fired power plants
| Jurisdiction | SO2 | NOx | PM | Hg |
| EU: from 2023, hard coal | 130 | 150 | 8 | 4 |
| EU: from 2023, lignite | 130 | 175 | 8 | 7 |
| China: from 2020 | 35 | 50 | 10 | 30 |
| EU: from 2015 | 200 | 200 | 20 | – |
| U.S. | 640 | 640 | 23 | 1.6 |
| China: All plants | 200 | 100 | 30 | 30 |
| South Korea | 286 | 308 | 36 | – |
| Japan | 200 | 376 | 46 | – |
| India: units installed after 2003* | 200 | 600 | 50 | 30 |
| Turkey | 400 | 200 | 50 | – |
| Chile | 400 | 500 | 50 | – |
| South Africa* | 680 | 1020 | 68 | – |
| India: units installed before 2003* | 200 | 300 | 100 | 30 |
| Indonesia | 589 | 589 | 107 | – |
| Australia | – | 856 | 109 | – |
| Philippines | 1607 | 1607 | 214 | – |
| Vietnam | 500 | 1000 | 400 | – |
Unit: mg/m3, except Hg as µg/m3, dry STP 6% oxygen.
*limits are technically in force but regulator has delayed or failed to require compliance


