Courtesy : www.mdpi.com
Energy efficiency research
The importance of showing the energy and environmental performances of public buildings is well known . In fact, the European association of local authorities, launched its Display® Campaign in 2001 in order to encourage governments to share with citizens this information. Different assessment processes or evaluations were created over the last two decades, in order to combine and create a new way to audit the energy performance in buildings. The energy performance assessment for existing dwellings (EPA-ED) methodology is supported by software, and has been developed in the framework of a European project that focuses on energy related issues for existing residential buildings . However, most of the time, the energy efficiency evaluations were not properly assessed or even not assessed at all . The main reasons were to keep the audits simple and low cost. Part of the different evaluations were carried out by the users, in simple and not assessed DIY (Do-It-Yourself) evaluations.
Another idea that is receiving stronger support in recent years is the Inter-Building Effect , where the buildings are connected and share a spatial relationship which could vary the building’s performance. This is also affected by the weather and climatology. All of this must be taken into account in order to predict the energy performance of buildings and their surroundings. These reasons have led to a growing tendency to search for new ways of enhancing public buildings’ performance, especially in those opened with long-term projections and for many hours during the day, such as universities . Many publications studied the new measures to incorporate them into university buildings and how these could affect in the energy costs of local authorities. Trying to achieve this goal of energy sustainability, governments have included new policies to improve both energy saving and renewable energy; for example, the inclusion of light-emitting diodes (LEDs) in indoor lighting instead of the old incandescent bulbs . Not only lighting has been studied during the last 15 years; some studies focused their research on all kinds of energetic items and especially new renewable ways of energy, and their consumption was compared to the previously used items in the buildings.
The main goal of this study is to determine the status and development trends in the field of sustainability over the last 40 years to help the research community better understand the current and future situation as well as to predict dynamic changes that may take place in lines of research. This kind of research has been successfully employed in other research projects .
2. Materials and Methods
Bibliometric is one of the main research approaches that is extended to almost all scientific fields, being increasingly used to assess peer reviewed research outputs. Scopus is accepted by the international scientific community as the largest database of citations and abstracts of refereed literature for the analysis of scientific publications . It was selected as the database used in this study because it has a complete catalogue of 20,500 publications from more than 5000 international publishers.
A full search was carried out with this database using the subfields’ title, abs, and authkey to find publications dealing with the topics of Sustainability and Energy Efficiency. The search scope was from 1976 to 2016. Other analyses show the success of this methodology .
Avoiding risks of distorting the results, the best option to search for the exact content was to use the following search string:
By combining the information gathered with the results of the field work, different indices and statistics of many fields of interest may be elaborated. The obtained publications referring to sustainability and energy efficiency during the period from 1976 to 2016 were analyzed through different aspects such as publication type, language, characteristics of scientific output, publication distribution by country and institution, distribution subject categories, citation analysis as well as the keyword occurrence frequency. The citation analysis includes a study on the influence of the h-index. This index was proposed in 2005 by Jorge E. Hirsch for the qualitative evaluation of researchers in the field of physics [36]. Researchers consider it not only the safest way of measuring the scientific quality of the work, but also quite a useful tool to evaluate the regularity of production and to predict future scientific output, as it takes into account both productivity and impact [37,38].
3. Results and Discussion
3.1. Type of Publications and Languages of Publications
The search considered 26,653 documents in various fields or types of documents. After analyzing the different types of publications (see Table 1), most of the research work was articles (14,768; 57%) and conference papers (7291; 28%). There was a significantly smaller quantity of Book Chapters (1364; 5%) and Reviews (1323; 5%) and a less significant number of other types of publications such as Books, Press Articles or Conference Reviews. Figure 1 shows a chart representation of document type distribution during the period 1976–2016.
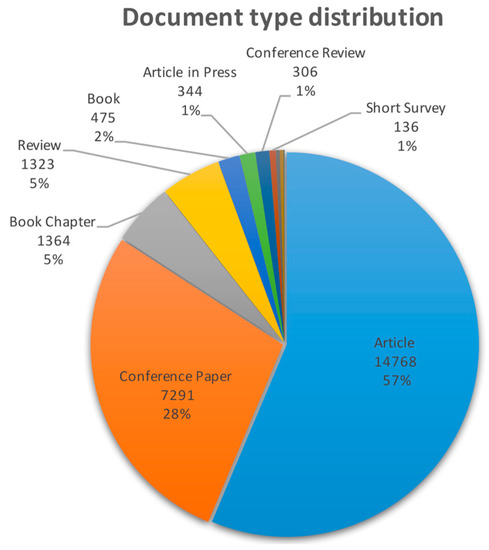
Figure 1. Chart representation of document type distribution during the period 1976–2016.
Table 1. Number of publications based on the language used.
Most of the publications taken into account are articles, which are mainly published in international journals. For that reason, 95% of the work has been published in English (25,320) and only 5% in other languages such as Chinese, German or Spanish. In Table 1, there is a list containing the number of publications for each language in the work analyzed.
3.2. Characteristics of Scientific Output
Figure 2a shows the output of the search in relation to the number of publications during the last 40 years. As we can see, the number of articles in this area was not very high until the early 2000s, when it started to grow from less than 300 publications per year to more than 3000 in 2015. This significant growth stems from the awareness of the ecological problem in the first decade of the century. Many policies were established around the different governments and institutions in order to reduce pollution and encourage efficiency and sustainability in public buildings. Figure 2b presents the same data but this time on a logarithmic scale, which provides some insight into the growth rate.
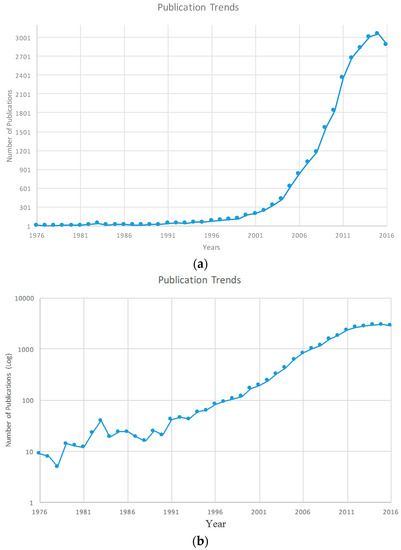
Figure 2. Trend in sustainability and energy efficiency publications during the period of 1976–2016 (a); Trend in sustainability and energy efficiency publications showing the data with a logarithmic scale along the y-axis (b).
3.3. Publication Distribution by Regions and Institutions
Figure 3 shows the distribution of publications according to country. Turquoise color indicates the largest number of publications, whereas the grey color indicates no publications at all. We can see how the United States is the country with the most publications, followed by China, England and Ireland. Other countries with a large number of publications are Australia, Germany and Italy. This information reveals the importance of energy efficiency and sustainability in developed countries, where governments are dedicated to stricter policies and this subject has become part of the goals of the richest countries. Table 2 shows the top 50 contributing countries and their total number of publications.
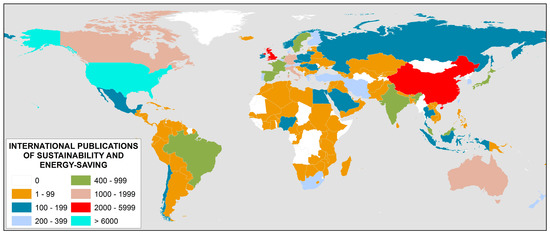
Figure 3. Distribution of Sustainability and Energy Saving publications according to country.
Table 2. Number of publications according to country and publications per capita.
Figure 4 shows the number of publications per year in relation with the country. As we can see, the United States is the most active country in this subject with more than 600 publications from 2012. The United States is followed by the United Kingdom and China with around 300 publications each year from 2012. All the countries show exponential growth in the number of publications during the years 2001 and 2003 as we have mentioned before. In Figure 5, the top 8 contributing countries during the last 16 years are presented.
Figure 4. Number of publications per year in relation with the country.
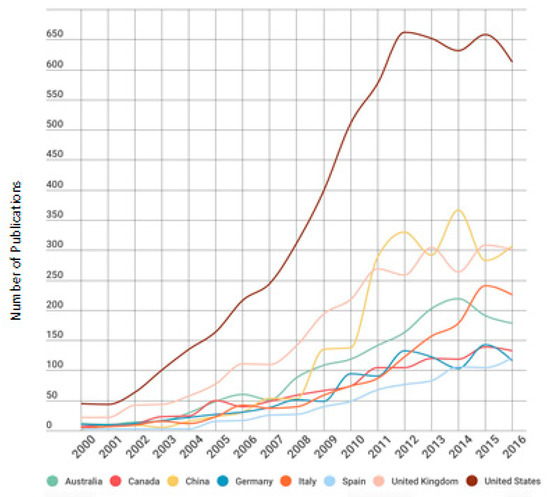
Figure 5. Top 8 contributing countries during the last 16 years.
Figure 6 shows the ranking of the top 15 most productive international institutions around the world in the last 10 years. The three institutions with the highest numbers of published works on the subject are Hong Kong Polytechnic University, Delft University of Technology and Tsinghua University.
Figure 6. Ranking of the top 15 most productive international institutions.
In Figure 7, we can see the activity of the top 10 institutions during the last 10 years as well as the percentage of the total publications in the subject. Table 3 shows the exact number of publications of each institution per year, during the period 2006–2016.
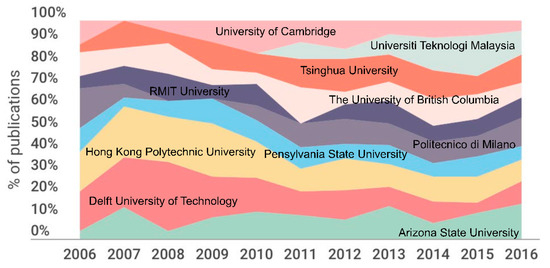
Figure 7. Time evolution of the 10 most productive institutions during the period 2006–2016.
Table 3. Publications from the 10 most productive institutions during the period 2006–2016.
Figure 8 is a map in which the relation between different countries that share a co-author in different publications is analyzed. The map was obtained with the software VOSviewer v.1.6.5 (CWTS Leiden of Leiden University, Leiden, The Netherland) including a CSV file obtained in Scopus with the most significant terms of our search. We can see a strong relationship between the USA and Canada; also between the UK and the USA, and the UK and Italy. The exchange of information and works between developed countries and also countries that share the same language is normal, although it is obvious that English is the international language and that is no longer a barrier. We can also see some countries that have no relationship with any country in this field.
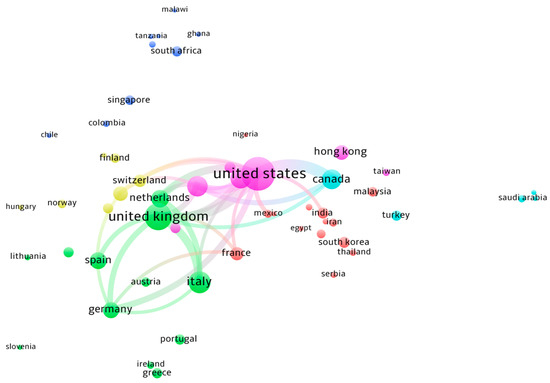
Figure 8. Network collaboration between countries.
3.4. Distribution of Output in Subject Categories and Journals
Figure 9 presents a graphic with the search results classified by subject. Engineering is the one with the highest rate (36.8%), followed by Social Sciences (27.4%) and Environmental Sciences (19.5%). We can observe an area called “Other” which includes the undefined subjects or areas. Table 4 gives us information about the number of publications according to the subject.
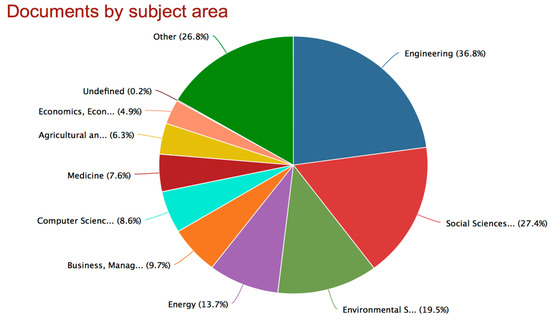
Figure 9. Distribution of publications according to subject, as classified by Scopus. Note: A document can be assigned to more than one single subject.
Table 4. Number of publications according to subject.
Figure 10 and Table 5 show the top five journals in which most of the work has been published. We have presented this data through the h-index, which is the most commonly used to analyze the publication level of a journal. In first place, we have the journal Energy and Buildings with a 103 h-index, followed by Journal of Cleaner Production with a 96 h-index and in third place is the International Journal of Sustainability in Higher Education with a 29 h-index. In the graph, we can see a relation between the SJR (Scientific Journal Ranking) index and the JCR (Journal Citation Report) index; we tried to obtain the most accurate data.
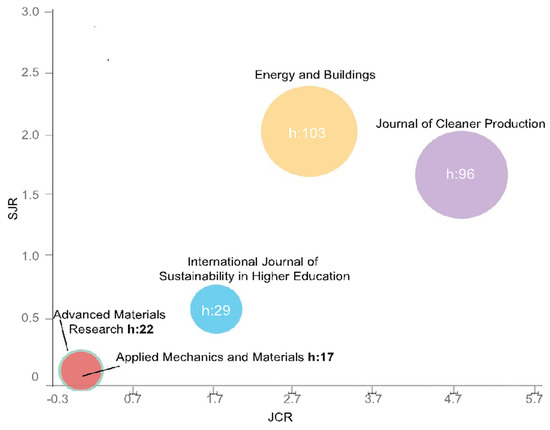
Figure 10. Ranking of the top five journals. JCR is the ranking in the Journal Citation Report by Thomson–Reuters, New York (USA), and SJR is the Scimago Journal Rank by Elsevier, Amsterdam (The Netherland). H-index is represented by the size of each circle.
Table 5. International journals with the most impact factor of scientific publications.
Today, it is necessary to combine different techniques and, above all, to look for applications of generated representations that allow us to go beyond the obvious from the analytical point of view. Figure 11 shows the overlay of the top journals in Environmental Science, Engineering and Energy areas at an international level, with 1597 journals being found. This graphic is a useful tool to analyze the presence of Scopus publications in the scientific domain that concerns us, as well as the global distribution of the editorial capacity of the different countries or regions.
Figure 11. Overlay in the subject areas Environmental Science, Engineering, Computer Science and Energy with the SJR-2015 representing the size of the node.
The map is generated from the relational matrix based on citation, co-citation and bibliographic coupling that form the almost 20,000 publications (magazines and congress proceedings) registered in Scopus. The interface allows the visualization of the bibliometric indicators of the publications and the structure of clusters that they form based on their use by the authors of the works. The interface can use the overlay mapping methodology to place the subsets of selected publications in the context of the overall structure of publications. The nodes’ colors correspond to the different clusters that the algorithm detects. There is a green cluster at the top devoted primarily to the social sciences and humanities. On the left side, there is an orange cluster corresponding to Psychology, Neuroscience, Nursing and Health Professions. Below is a pinkish cluster dedicated to Medicine. At the bottom, this cluster is merged with a blue–green dedicated to Ophthalmology and Optometry, and another green of Dentistry. Then, on the right side, two clusters are observed, one yellow dedicated to the sciences of the life (Agricultural and Biological Sciences, Environmental Science…) and another purple one dedicated to Chemistry, Materials Science and Chemical Engineering. These two clusters are merged with two others, one reddish brown from Earth and Planetary Sciences and another light blue, rather elongated beginning with Physics and Astronomy, Mathematics, Computer Science and ending with Decision Sciences when it merges with Economics, Econometrics and Finance. It is observed that the main group of magazines is in the right part of the thread, which matches with the areas of Environmental Science, Engineering, Computer Science and Energy.
3.5. Analysis of Authors and Keywords
Figure 12 and Table 6 show the five most relevant authors in the field of sustainability in the last 10 years. It can be clearly observed that Cotana, F. is at the top of the ranking with 113 publications since 2006. This author has an h-index 18 and most of his works have been published by the Universita degli Studi di Perugia. Following him is Orosa, J.A. with 105 works. This author of the University of Coruña has an h-index of 13, while Jia, Q.S., Pisello, A.L. and Bragança, L. have published a total of 97, 73 and 51 articles respectively in the period 2006–2016. It is also observed how in recent years there has been a significant increase in the number of publications on the issue at hand. A relevant fact that supports this assertion is that the sum of publications over the last three years accounted for more than 50% of all publications in the last decade. In 2014, a total of 84 publications were obtained among the works of the five most relevant authors.
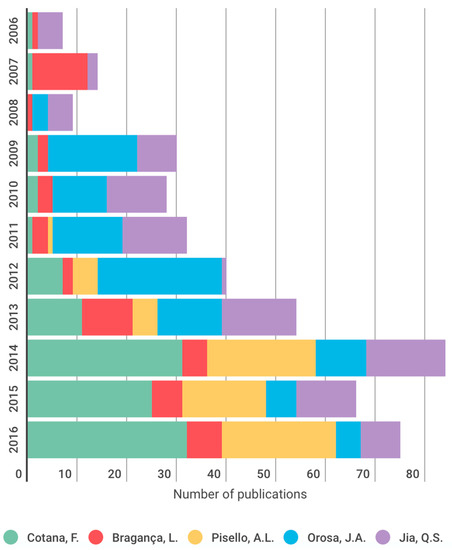
Figure 12. Distribution of authors according to the number of publications during the period 2006–2016.
Table 6. Number of publications of the most relevant authors between 2006 and 2016.
In Figure 13, the relation between co-authors who collaborated with the most important authors of Table 6 are shown. We can see a more frequent relationship between Asian authors, probably because of the language and the close distance of their institutions.
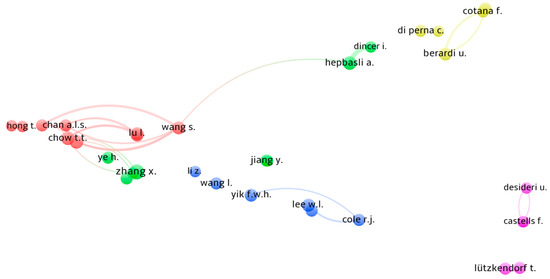
Figure 13. Co-authorship network (related to Table 6).
It is important to analyze the keywords used in the search, in order to specify which branches and areas have been taken into account in the work. In total, our search resulted in 26,644 items in the last 40 years. The keyword “Sustainable Development” was present in 6679 items (25.1%). This was followed by “Sustainability” with 5864 (22%) and “Energy Conservation” with 3512 (13.2%). Table 7 shows the 40 most relevant keywords during the analyzed period.