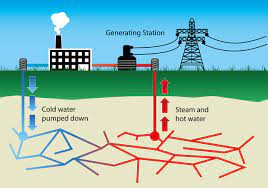
Geothermal and wind energy
Courtesy : core.ac.uk
The agri-food chain consumes about one third of the world’s energy production with about 12%
for crop production and nearly 80% for processing, distribution, retail, preparation and cooking
(Fig. 1.1) (FAO, 2011b). The agri-food chain also accounts for 80–90% of total global freshwater
use (Hoff, 2011) where 70% is for irrigation alone. Additionally, on a global scale, freshwater
production consumes nearly 15% of the entire energy production (IEA, 2012). It can therefore be
argued that making agriculture and the agri-food supply chain independent from fossil fuel use
has huge potential to contribute to global food security and climate protection not only for the next
decades, but also for the coming century. Provision of secure, accessible and environmentally
sustainable supplies of water, energy and food must thus be a priority.
One of the major objectives of the world’s scientists, farmers, decision-makers and industrialists
is to overcome the present dependence on fossil fuels in the agri-food sector. This dependency
increases the volatility of food prices and affects economic access to sustenance. For example,
Figure 1.2 shows the close interrelationship between the crude oil price index and the cereals
price index. An increasing energy demand for cultivation is particularly important in regions
Figure 1.1. Direct and indirect energy inputs in the food sector (FAO, 2011b).
1
View metadata, citation and similar papers at core.ac.uk brought to you by CORE
provided by University of Southern Queensland ePrints
Bundschuh ch001.tex 5/4/2017 9: 16 Page 2
2 J. Bundschuh et al.
Figure 1.2. Dependence of fossil fuel price index and the cereal price index for the period 2000–2013
(IRENA, 2015, based on FAO Food Price Index and BP Statistics Review of World Energy;
base 2000 = 100).
with expanding irrigated agriculture using pumped water. This translates to a food-related risk to
energy security.
The development and commercialization of renewable energy sources such as solar, wind
and geothermal provides great potential to reduce costs in the agri-food sector. For instance, in
addition to power generation, the main uses of geothermal waters are for space heating, district
heating, spas balneology, aquaculture and greenhouse heating (Lund and Boyd, 2015). However,
much work remains to be done to make better use of renewable energy in the agri-food sector.
The aim of this introductory chapter is to critically review recent developments in solar, wind
and geothermal energy applications in agriculture and the agri-food sector such as processing,
distribution, retail, preparation and cooking.
1.2 ENERGY DEMANDS IN AGRICULTURE
1.2.1 Energy use in agriculture
Agriculture and food systems rely on a variety of energy sources, including renewable and nonrenewable resources—such as fossil fuels—as well as human and animal labor. At present, fossil
fuels, in their various forms, supply most of the energy required by agriculture that feeds the
world (Maraseni et al., 2015). Food production is an increasingly energy-demanding sector and is
needed in all stages of the agri-food chain. In many cases, energy costs may represent a significant
proportion of the total agricultural production input cost, including the price of irrigation, as well
as the outlay of manufacturing and transportation of various chemicals and fertilizers.
Energy is used both on-farm and off-farm. It can be further divided into direct energy used,
i.e. the fuel and electricity consumed, and the indirect energy (embodied energy) involved in the
manufacturing of all other inputs, such as equipment and agro-chemicals (Chen et al., 2010).
Direct energy may be consumed in three major forms on farms: (i) general electricity usage
for lighting, appliances, irrigation; (ii) fuel use for machinery, tractors and vehicles; and (iii)
heating/cooling for industries such as dairy, horticulture, piggeries and poultry. In field crops,
irrigation energy may account for up to 85% of total direct energy use (Maraseni et al., 2015).
With the new technologies currently under development, Renewable Energy (RE) with its rapidly
falling costs, is being increasingly employed in agriculture.
1.2.2 The energy management process
Energy audits are a crucial part of farm energy management (Chen and Baillie, 2009a). This type
of audit refers to the systematic examination of a farm, facility or site, to determine whether, and to
Bundschuh ch001.tex 5/4/2017 9: 16 Page 3
Solar, wind and geothermal energy applications in agriculture: back to the future? 3
what extent, it has used energy efficiently. An energy review determines how efficiently it is being
used. It also identifies energy cost-saving opportunities and highlights potential improvements
in productivity and quality. An energy check may also assess potential savings through strategies
such as fuel switching, tariff negotiation and demand-side management (e.g., by changing to
alternative farming systems and farm layouts). An energy assessment may be undertaken as part
of a broader plan to manage production inputs on-farm (Chen and Baillie, 2009a). The objectives
of energy audits include:
• Conserve energy inputs.
• Reduce greenhouse gas emissions.
• Achieve operational and cost efficiencies with improved productivity and profitability.
Extensive research has been conducted on both energy use and conservation in agriculture.
Recent results of energy efficiency programs have shown considerable variation in energy use
between different crops as well as different farms of similar production systems (Chen et al., 2015).
Pellizzi et al. (1988) found that in Europe, the range of field energy consumption for wheat-like
cereals varied from 2.5–4.3 GJ ha−1. For cotton, a study by Chen and Baillie (2009b) showed that
the direct energy inputs for cotton production in Australia ranged from 3.7–15.2 GJ ha−1. Diesel
energy inputs ranged from 95–365 L ha−1, with most farms using between 120–180 L ha−1. Dry
land cotton was at the lower end of this range. The direct on-farm energy use of some nurseries
may be up to 20,000 GJ ha−1 (Chen et al., 2015).
1.3 THE WATER-ENERGY-FOOD-CLIMATE NEXUS
Agricultural productivity largely depends on the availability of water, energy and land resources.
In the past, the agriculture sector enjoyed increasing productivity and was thus able to feed the
growing world population. For example, in 2016, the world cereal production was 2,526 Mt (million metric tons) compared with 2000 Mt in 2006 (FAO, 2016). However, the agriculture industry
in the 21st century faces numerous challenges. It must feed a rapidly increasing population with
a depleting availability of resources (FAO, 2013; Haddeland et al., 2014). At the same time it
needs to adapt to a changing climate and reduce greenhouse gas (GHG) emissions (Kulak et al.,
2013). Therefore, acclimatizing to climate transformation and the necessity to increase agricultural productivity with minimum use of these resources is a major requirement of the 21st century
(Jackson et al., 2010).
It can be argued that the irrigation industry is a significant contributor to the global economy.
However, the industry is currently under pressure to cut water use as an adaptation to a reduction
in water availability owing to climate variability and change, and competition from other sectors
including demands for environmental water (Ward et al., 2006). The conversion of less efficient
flood irrigation systems to more efficient pressurized irrigation systems has been heralded as
one way of increasing water use efficiency and creating water savings (Mushtaq et al., 2013).
However, pressurized irrigation systems may alter patterns of on-farm energy consumption and
may increase cropping intensity. More intensive land use might involve more fuel, farm machinery
and agrochemicals, and the production, packaging, transportation and application of these also
requires significant energy resources, leading to an increase in GHG emissions (Maraseni and
Cockfield, 2011a,b; 2012; Maraseni et al., 2012a; 2012b).
This suggests that there is a potential conflict in terms of mitigation and adaptation policies,
and thus warrants a comprehensive and robust investigation. There is very little research in
this important policy area. Topak et al. (2005) and Baillie (2009) have compared the energy
consumption of various irrigation systems, but these studies failed to provide a complete picture as
they did not analyze soil carbon, GHG emissions associated with the use of primary farm inputs,
or water consumption and GHG implications of more intensive cropping systems. Similarly,
Maraseni et al. (2012a; 2012b) tried to assess GHGs and water saving implications of converting
flood irrigation systems into pressurized irrigation systems through five case studies (three cotton,
Bundschuh ch001.tex 5/4/2017 9: 16 Page 4
4 J. Bundschuh et al.
one lettuce and one lucerne) in southern Queensland, Australia. Yet, these studies considered only
one crop and did not assess all crops in a rotation. Even within the same irrigation technology,
the level of farm inputs (i.e. fuels, agrochemicals, machinery) and thus the energy consumption
and GHG emissions due to production, consumption and use of those farm inputs, could vary
significantly between crops in a rotation. A farmer may employ more agrochemicals in a first
crop with the intention to use less in the following crop. Therefore, comprehensive studies of
water and energy consumption, across full cropping rotations covering a wide geographical area,
are necessary.
1.4 GREENHOUSE GAS EMISSIONS AND CARBON FOOTPRINT OF AGRICULTURE
1.4.1 Sources of greenhouse gas emissions from agriculture
Agriculture and food systems play an important role in climate change because of their significant
energy use and also as a potential source for RE such as bio-ethanol and bio-diesel. Overall, the
main sources of emissions in agricultural production are (Chen et al., 2010):
• Emissions from energy used to power various machinery and processes which may include
both the on-farm and post-farm activities.
• Emissions from energy used to produce agricultural inputs such as fertilizers and pesticides
(i.e. pre-farm).
• Direct soil emissions or sequestration in soil (on-farm).
• Soil nitrous oxide (N2O) emissions from the application of nitrogen fertilizer and manures
(on-farm).
• Methane (CH4) emissions from prolonged water-logging or from the digestion systems of
livestock (on-farm).
With current technology, burning one liter of petrol or diesel would, on average, emit 2.3 and
2.7 kg CO2, respectively. It is also noted that for the same power output, greenhouse gas emissions
from electricity would vary considerably if different fuels were used to generate it. Furthermore, it
is estimated that with the current manufacturing technology, the production of one kg of nitrogen
fertilizer would require the energy input equivalent to 1.5–2 kg of fuel, while 1 kg of pesticides
would require the energy input equivalent to up to 5 kg of fuel.
Finally, carbon emissions & sequestration in soil, as well as soil nitrous oxide (N2O) emissions
from the application of nitrogen fertilizer and manure, are also more difficult and expensive
to measure accurately because their annual fluxes are often small, variable and distributed over
large areas. Methane and N2O have global warming potentials 25 and 298 times that of CO2
respectively, over a 100-year time period (IPCC, 2007).
1.4.2 Overview of global agricultural emissions
There were approximately 50.1 GtCO2e greenhouse gas (GHG) emissions from anthropogenic
sources in 2010 (IPCC, 2014). Agriculture shares about 11% of these emissions (Tubiello et al.,
- This percentage relates to direct sources only. If emissions from indirect sources are considered, a further 3–6% of global emissions (Vermuelen et al., 2012) are accounted for.Approximately
60% of all N2O and 50% of all CH4 emissions originate in the agricultural sector (Smith et al.,
2007).
Similarly, about 38% of direct agricultural emissions are attributed to N2O from soils, 32%
to CH4 from ruminants, 12% to biomass burning, 11% to CH4 from rice production and 7% to
manure management (Bellarby et al., 2008). There is evidence of an upsurge in GHG emissions
with rising farm inputs, due to growing mechanization and modernization (Graham and Williams,
2003; Maraseni, 2007; Maraseni and Cockfield, 2011a; Mushtaq et al., 2013). For example,
during the period 1990–2005, global agriculture emissions increased by 14%, an average rate of
Bundschuh ch001.tex 5/4/2017 9: 16 Page 5
Solar, wind and geothermal energy applications in agriculture: back to the future? 5
49 MtCO2-e year−1 (USEPA, 2006). Therefore, meeting the proposed 2◦C climate stabilization
target is not possible without reducing agrarian discharges.
Agricultural emission from developing countries is much higher than that of developed nations.
For example, in 2005, developing countries were responsible for 74% of global agricultural
emissions, whereas developed states were accountable for only 26% (Smith et al., 2007). The
proportional contribution of agricultural emissions for developing countries has been increasing
faster due to rapid increases in farm inputs to feed growing populations with limited farming
areas (Tubiello et al., 2015). Therefore, without developing countries shouldering responsibility,
a reduction in global agricultural emissions is not possible.
FAO (2014) predicts that there will be over 9 billion people globally by 2050. In order to
feed them, agricultural production should increase by 60% by 2050. About 80% of the yield rise
will come from intensification (i.e. higher yields with more fertilizer, pesticide and water inputs,
multiple cropping, shorter fallow periods and improved seed varieties) and another 20% will
come from extensification (Johnson et al., 2014). The ratio will be 70:30 in developing countries.
Both these intensification and extensification processes will increase the share of agricultural
emissions. However, research by Johnson et al. (2014) showed that the selective extensification
of agriculture could save some 22 GtCO2e emissions by 2050, compared with a business-as-usual
approach. Consequently, a wise land-use planning and coordinated approach between government
departments is necessary for reducing agricultural emissions.
1.4.3 Life cycle assessment (LCA)
To achieve sustainable development, the first step would be to understand and identify where the
environmental impacts and damages actually occur so that targeted remedy actions can be taken.
To determine the carbon footprint of agricultural products, it is necessary to identify and consider
the full life cycle of the products, from growing to harvesting, as well as their waste management
and finally disposal or recycling of the packaging (Klöpffer, 2012). Life cycle assessment (LCA)
is a cradle to grave analysis. It examines a system performance starting with the extraction of
raw materials from the earth followed by the operations, until the final disposal of the material
as waste. This provides the knowledge of how much energy and raw materials are used at each
stage of the product life and how much different types of waste are generated. LCA thus helps
to analyze the process involved, and allows the consumer more information on the choices of the
product. In particular, compared with other methods LCA analysis has the advantage of being able
to quantify the magnitude of the potential environmental saving in each environmental category,
and to avoid the pitfall of just shifting the environmental impacts from one category to another. An
LCA project should comply with the international standards ISO 14040–14044 (Klöpffer, 2012).
Generally, an LCA analysis consists of the following four steps:
• Initiation (goal and scope definition, project planning).
• Inventory analysis (data collection, identifying all relevant input and output items).
• Impact assessment (analysis, quantification and evaluation of impacts on ecosystems, human
beings and resources use).
• Interpretation and improvement assessment (sensitivity study, evaluation of options to reduce
environmental loads).
Overall, LCA is often a computer-based data-intensive operation. It requires time, skill, a large
amount of data and software to manipulate the data. Particularly, industry and region specific
Life Cycle Inventory (LCI) is essential to undertake a proper LCA project, as differences in
the input data as well as project methodologies can significantly affect results and lead to highly
variable conclusions. Furthermore, international standardization is likewise necessary (Roy et al.,
2009). Decision support tools for best practices and most cost-effective designs and management
must be developed. In addition to energy and greenhouse gas emissions, the quantification of
the impacts of water and land footprints, and the effects of pesticides and biodiversity are also
receiving increasing attention.